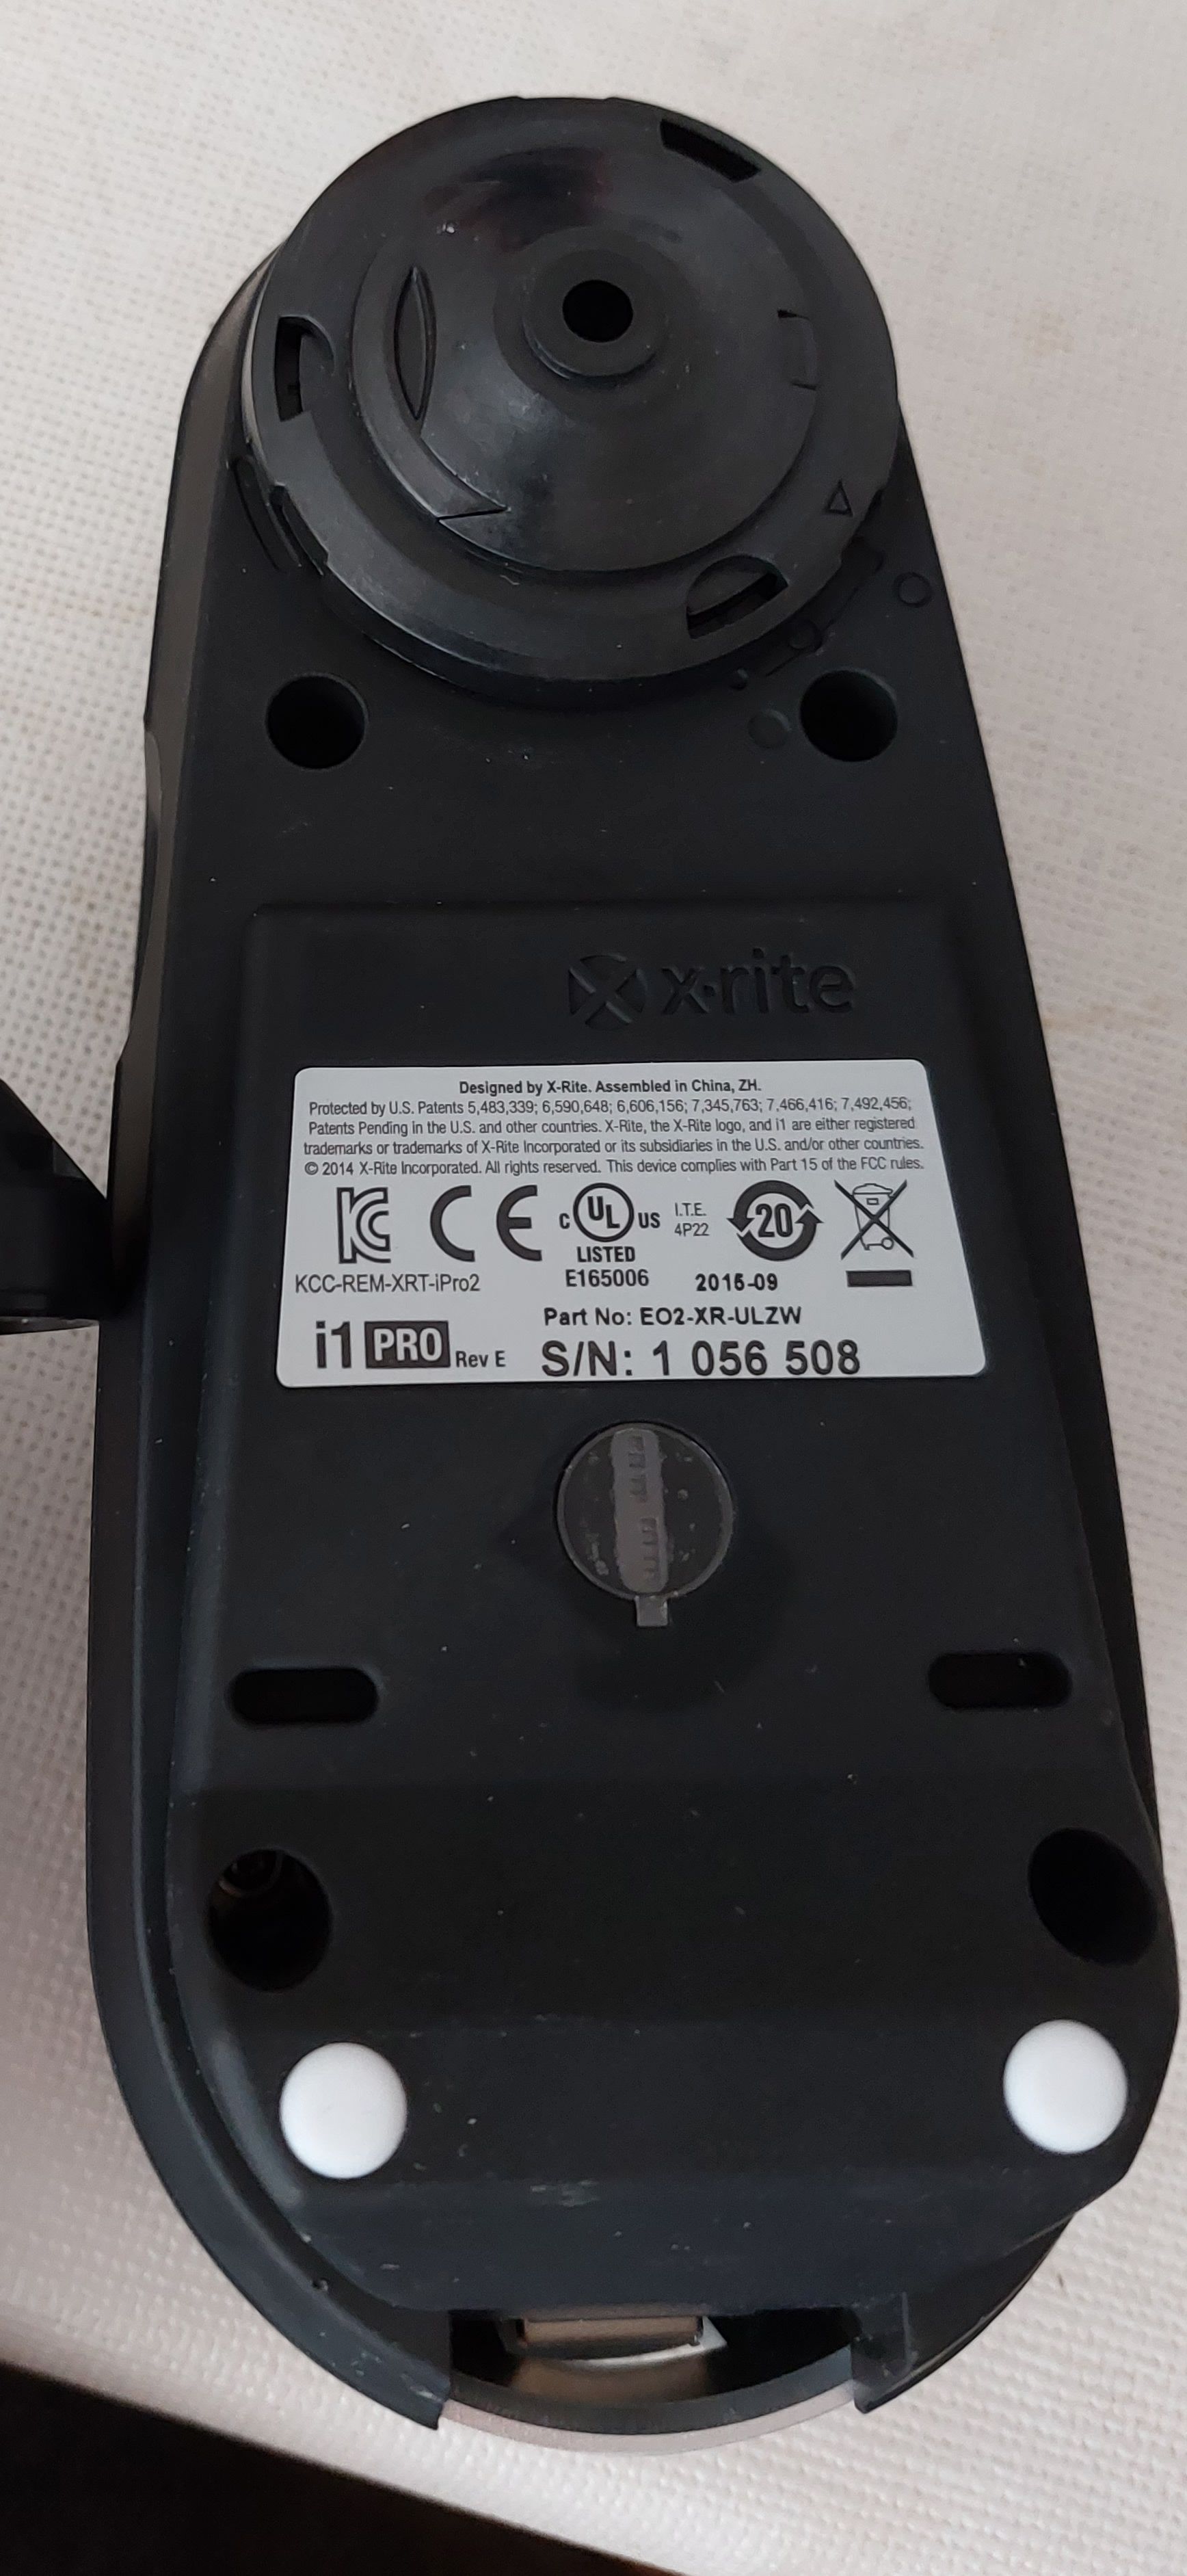
Verification of a xrite i1 pro
The xrite i1 pro are high precision mechano optical measurement
devices that are sensitive to shock, vibration or temperature.
Here I describe a method to verify the correct measurement.
Principle of a spectrometer
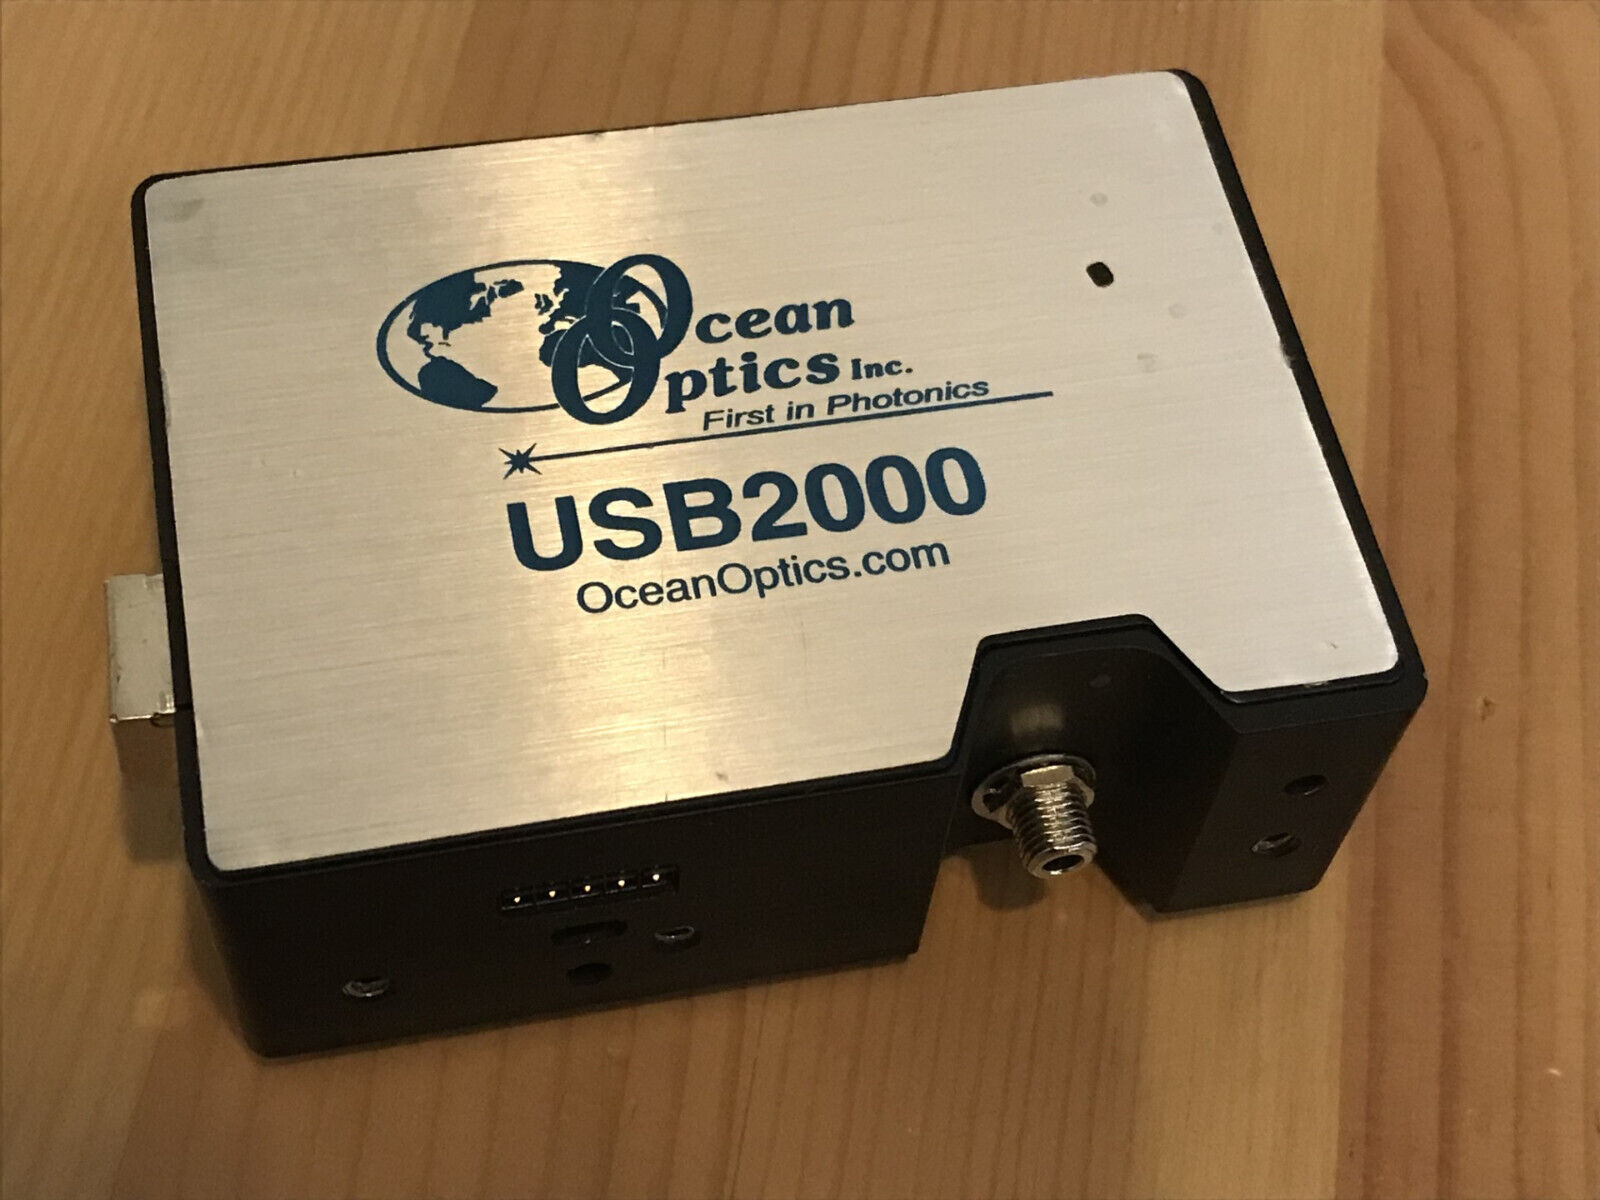
This is a USB2000 spectrometer from Ocean Optics (now the company is
called "ocean insight"), a 4000 EUR spectrometer used for
professional measurements with manufacturer calibration and
certification.
Information on the principle of the USB 2000 spectrometer
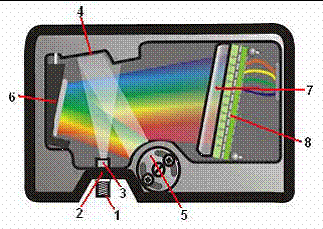
Components:
1 SMA Connector
2 Slit
3 Filter
4 Collimating Mirror
5 Grating
6 Focusing
Mirror
7 L2 Detector Collection Lens
8 CCD Detector (UV or VIS)
As can be seen from the picture, the correct positioning of the
optical elements is crucial, this holds for the elements (3), (4),
(6), (7), and (8). During manufacturing the position of the grating
(5) can be changed and is used for the calibration of the
spectrometer.
If a misalignment happens, two type errors may occur
1.) constant shift of all wavelength
2.) asymetric shift or spread of light spectrum
This misalignment is introduced by a mechanical movement of the
optical elements, this can be caused by vibration, shock or other
"abuse" of the spectrometer.
Both types of errors can be found using the following method.
Detection of misalignment using monochromatic light sources
These are 3 LEDs which are used using a well defined voltage of
4.0V (with resistors).
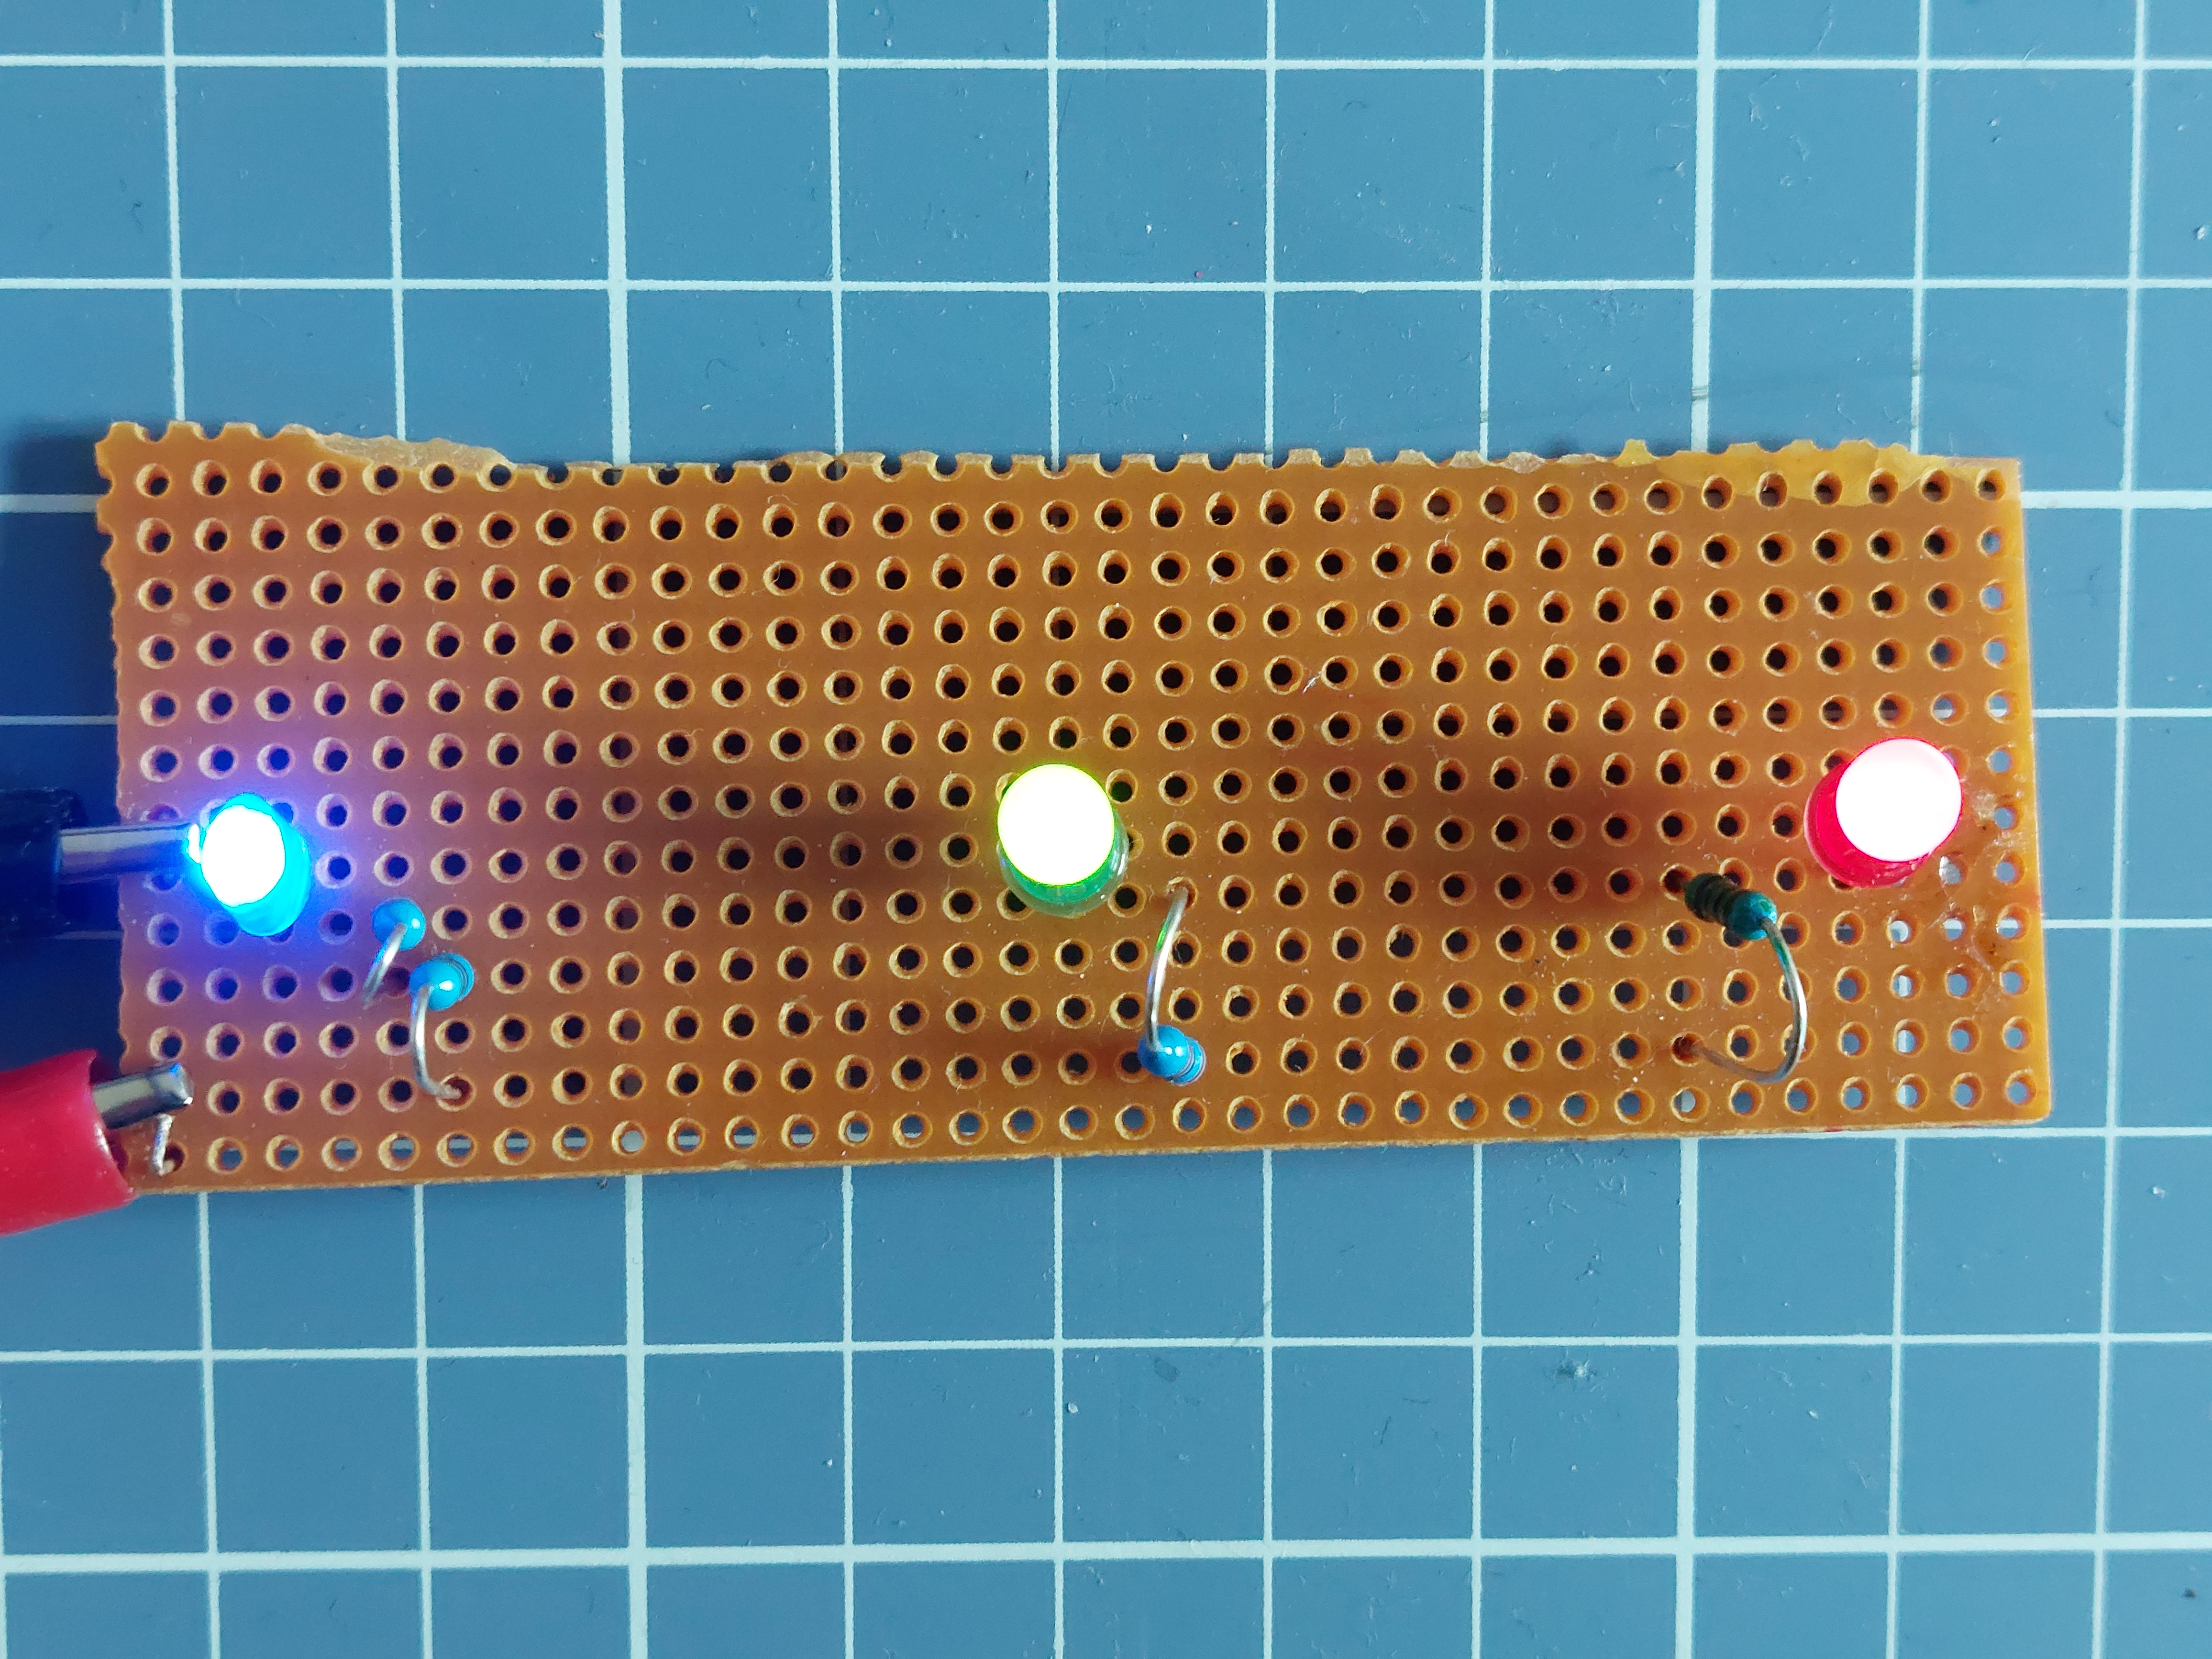
These 3 light sources will be measured one after another. For better
clarity all 3 spectra are shown in one diagram.
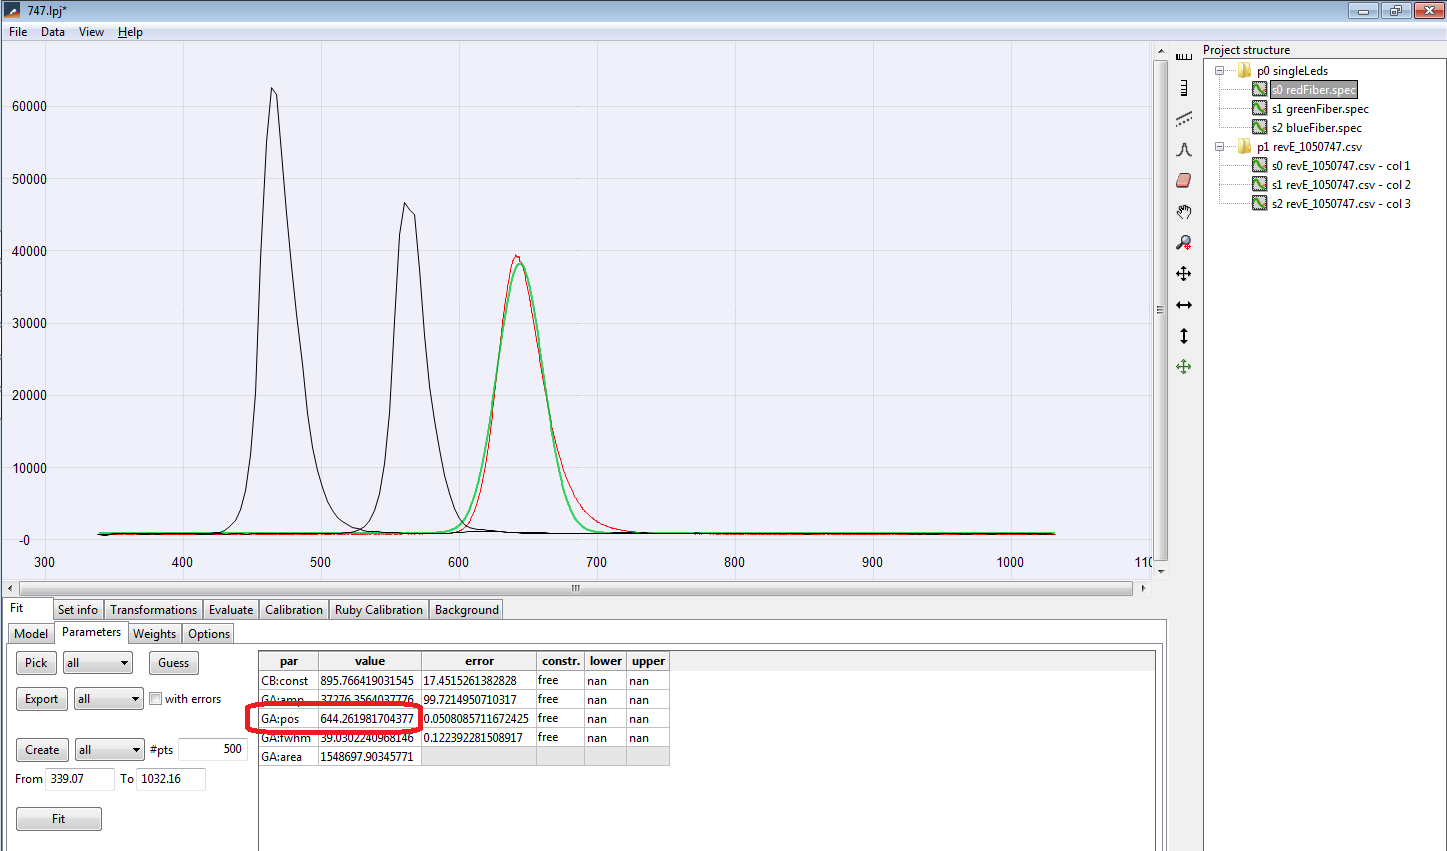
The spectrum are then fitted via a gaussian curve. The only relevant
information is the GA:pos, which shows the central wavelength of the
gaussian, here it is 644.26nm.
The same is done with the xrite i1 spectrometer:
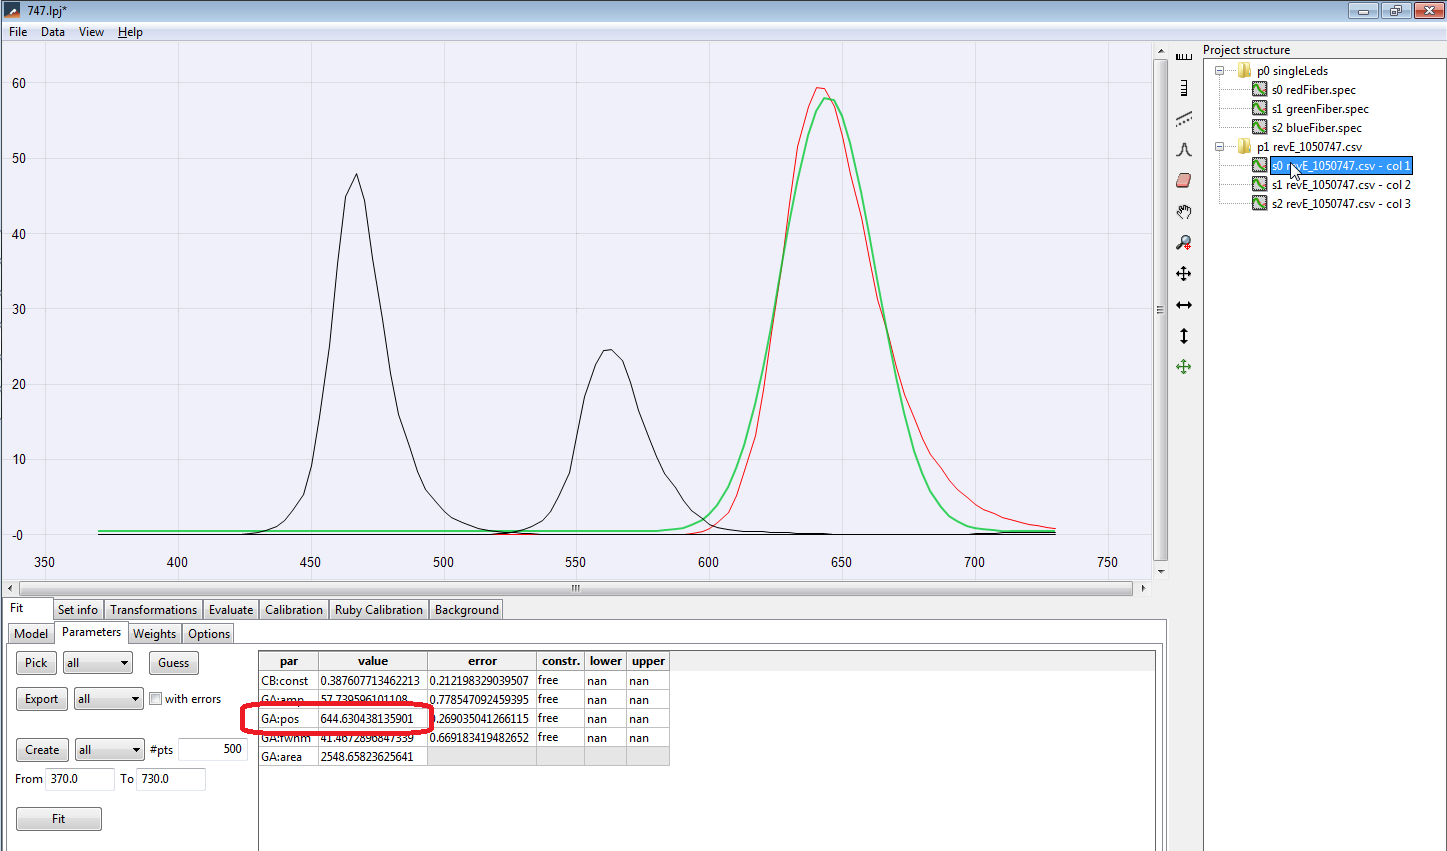
(The xrite has a much smaller wavelength range which ranges from 370
to 730nm.) The peak wavelength of the red LED is 644.63nm.
We now compare all 3 peak wavelength for the 3 light sources:
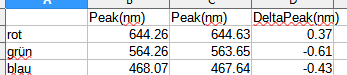
The deviations are small and not systematic. -> all good.
Misaligned i1 device
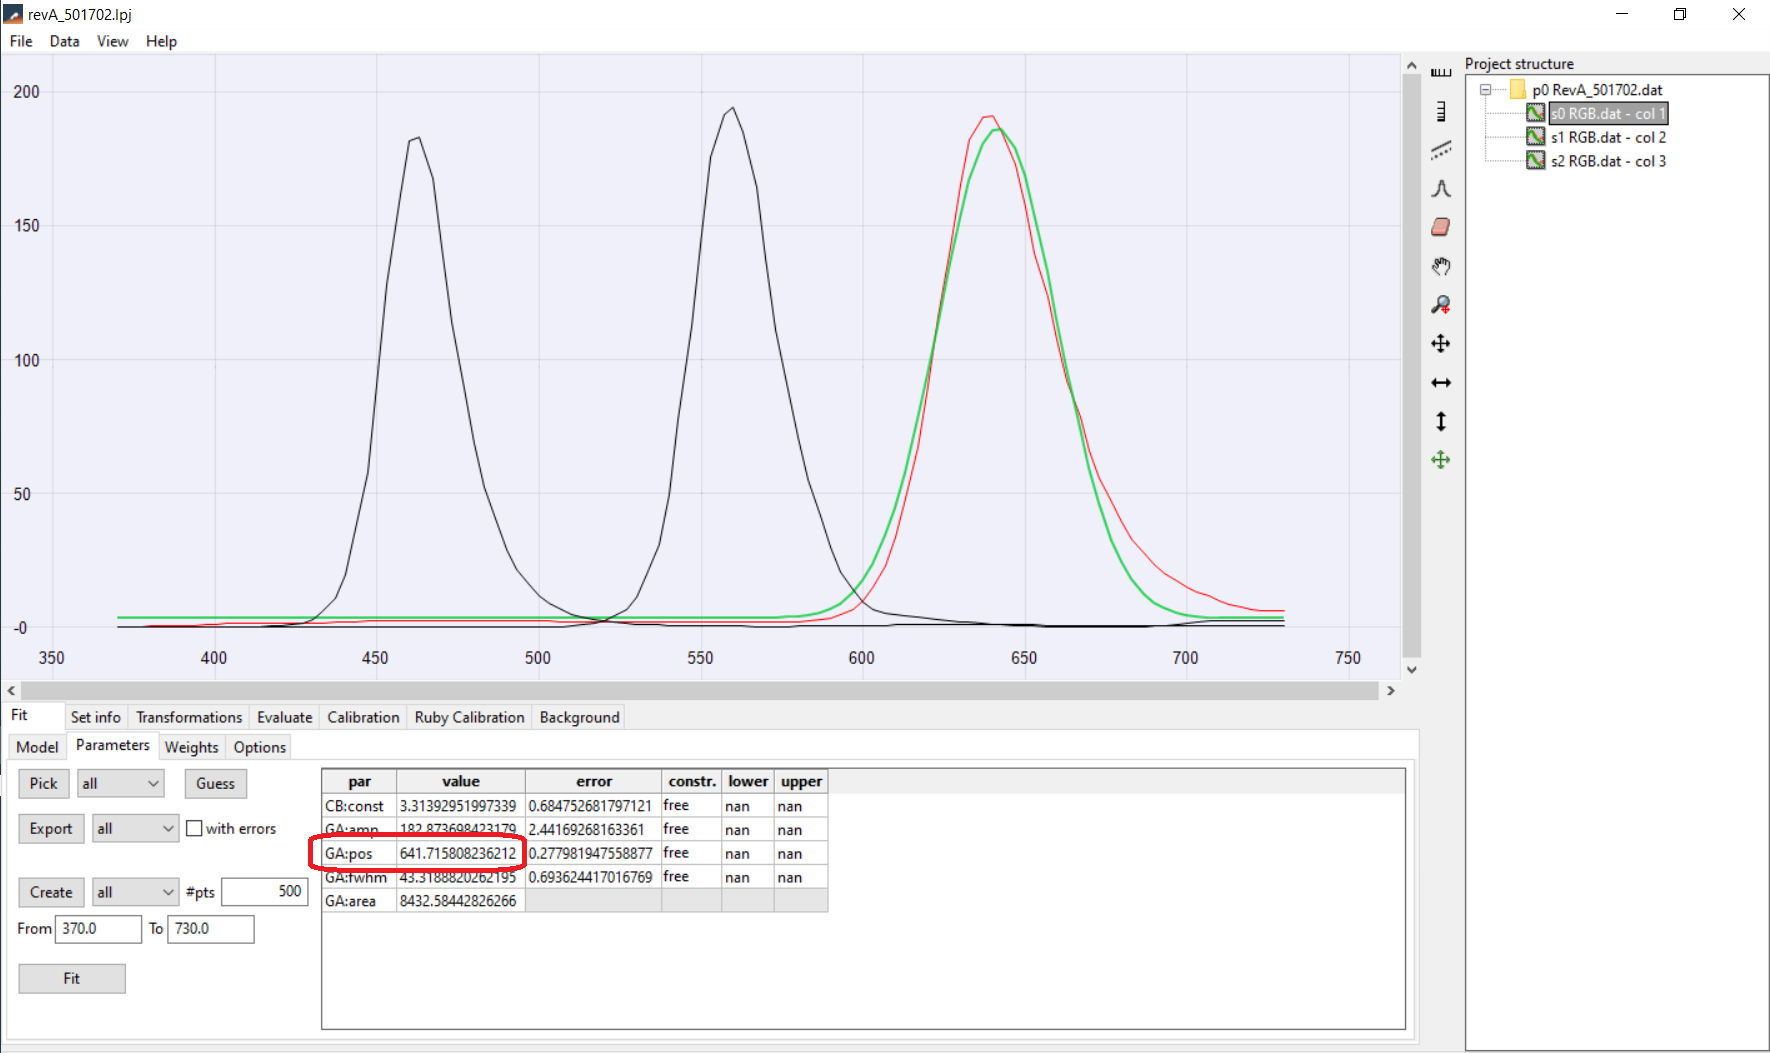
Again we compare all 3 peaks:
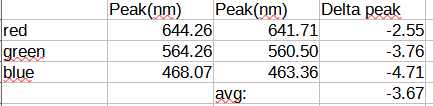
The deviations are large, partly systematic (all negative) but not
constant -> not good.
Red is shifted by 2.5nm, blue by 4.7nm, all three peaks on average
by 3.67nm. This results in a color cast when doing calibration with
this device, the colors will be too warm.
Besides the wrong results, the device performs "normal", so there is
no way to detect this error during normal usage.
You can buy tested devices at my shop luminous-fidelity_de or directly contact me
via eMail
info@luminous-fidelity.de .